One can notice the depth of the ocean floor, on a global scale, ranges between -2000 and -6000 meters. In some regions though like the Pacific exceed this range and reach 11 kilometers below the sea surface. One such region is the deepest point on Earth, the Mariana trench as shown below followed by a map for a perspective of its location.
An interface for interoperability between the Generic Mapping Tools (GMT), a tool used by geophysicists to create research-quality figures, and Matlab has recently been developed that allows GMT users to interact with Matlab and Matlab users to make use of GMT.
GMT wrappers are currently also being developed for the Python programming language, particularly to be used in the IPython/Jupyter notebook due to an initiative by Leonardo Uieda (and his professor Paul Wessel) whose Postdoc is being funded by the NSF. You can watch his talk at the SciPy 2017 conference below.
Some of the mentioned advantages to which I attest include:
Begin and End statements are introduced to eliminate the need to pipe postscript results into a file in each line of code being written. This also eliminates the need to use the -K and -O flags which keep the file open and updates it, respectively. The -K and -O flags are a major confusion for newcomers to GMT.
temporary files are created under the /tmp directory, in Linux, so they will automatically be cleaned once the jupyter notebook is closed or the operating system is rebooted. Moreover, every project will have its own directory so files from different projects don’t get mixed up.
GMT documentation straight in the Jupyter notebook
Matplotlib- & Basemap-like behaviour, particularly inline viewing of figures, using gmt.show()
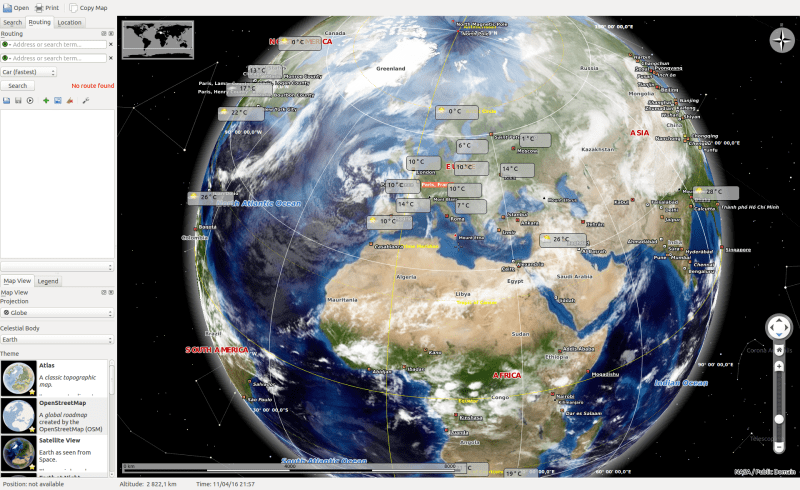
Everyone uses digital maps these days, I assume. At least I do. Since I’ve been using them more often lately, I checked if there are any apps for Linux and especially Ubuntu. The search returned 4 apps.
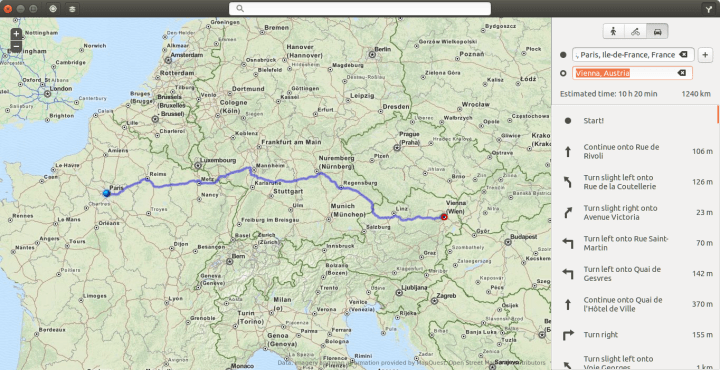
Maps (aka gnome-maps)
is a map application for GMONE. Its use is slick and fast. It is supposed to be simplistic
Search and directions is functional (based on MapQuest if I’m not mistaken) but geolocation isn’t. Moreover, the satellite imagery is not available at high resolution.
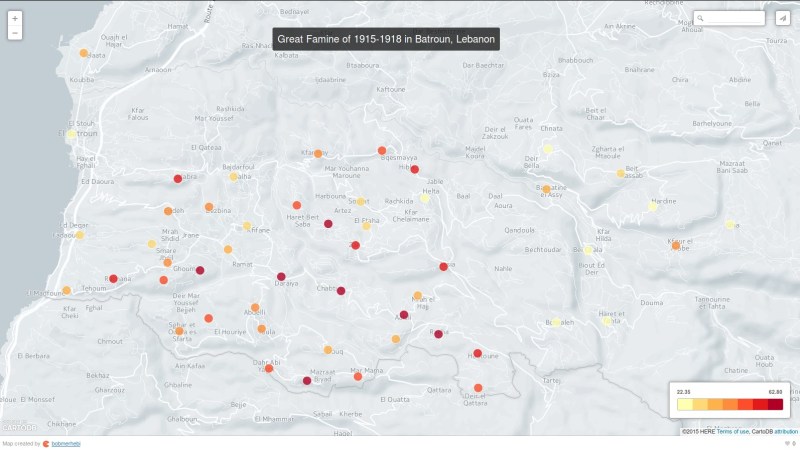
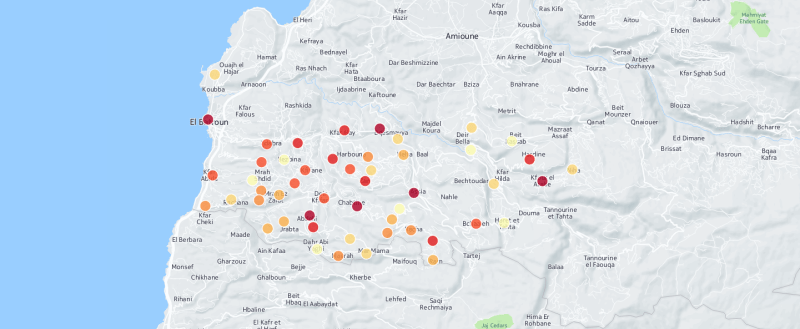
In a previous post I shared maps of the the number of dead in Batroun, Lebanon due the great famine of 1915. The maps have since been updated after normalizing the data so they display the “percentage” of dead. Below is the full story of the Great Famine.
The years 1915 to 1918 are considered one of the worst years in the history of Lebanon if not the Middle East. At the time the country was not known as Lebanon but was rather part of the Ottoman Empire. While many were dying on the front lines of the First World War in Europe the Lebanese were starving to death.
When the Ottoman Empire joined Germany in the war the allied powers enforced a maritime blockade on the Mediterranean to prevent any resources from reaching the empire. In return Jamal Pasha, appointed as minister of navy over Lebanon at the time, also enforced a similar blockade along the eastern Mediterranean to block supplies to the British in the Seuz Canal which also prevented any supplies from reaching the people of Lebanon. This was a major cause to the death of thousands. He came to be referred to as “Aljazzar” or “Alsaffah” which mean “the butcher” and “the blood shedder” due to his killings of Lebanese and Syrian people.
The following (bubble and choropleth, respectively) maps display the magnitude of people who died in Batroun (a city of northern Lebanon) during the 1915-1918 famine that hit Lebanon.
For extensive information on this famine I refer you to the French book “Histoire de la Grande famine au Mont-Liban (1915-1918) – Un genocide passe sous silence” by professor Antoine Boustany (ISBN: 9789953031194). You can find it at Librairie Antoine (order it online here).


You must be logged in to post a comment.