Attending the PhD Summer School on Remote Sensing for Wind Energy at the Institute of Wind Energy at the Denmark Technical University (DTU Riso) in Roskilde, Denmark.
Day 1 focused on LIDARs. It included a walk to check out the historical met mast and a view of the wind turbines (see images).
The ocean is a complex system as a result of coupled forces arising from fluid dynamics. This coupling of the difference forces in the ocean (currents, surface and internal waves, swell, etc…) and the rotating Earth result in a sea surface with complex features obscuring the depths of the ocean.
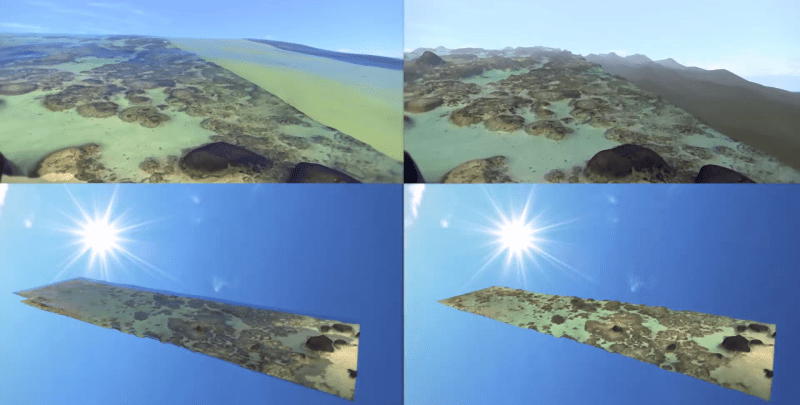
Utilizing machine learning NASA AMES research scientist Ved Chirayath devised a method called fluid lensing to reduce and make these effects almost negligible. This resulted in a fluid cam capable of peering down to a depth of 10 meters which makes it very useful for studying coastal and coral systems.
I quote from NASA’s website:
So far Fluid Cam, the imaging instrument that carries the fluid lensing software, has flown only on a drone. Someday, this technique could be flown on an orbiting spacecraft to gather image data on the world’s reefs.
One can notice the depth of the ocean floor, on a global scale, ranges between -2000 and -6000 meters. In some regions though like the Pacific exceed this range and reach 11 kilometers below the sea surface. One such region is the deepest point on Earth, the Mariana trench as shown below followed by a map for a perspective of its location.
When ESA’s SMOS satellite was placed in orbit in 2009, it transpired that its signal was being interrupted by numerous illegal transmitters around the world. However, by working with national frequency protection authorities, 75% of these transmitters have now been shut down. Nevertheless, this is a laborious process and some regions, such as the Libyan coast and the eastern Mediterranean Sea, remain contaminated where mitigation strategies have not yet been successful. Source: ESA
Thanks to new processing techniques, information from ESA’s SMOS mission can be used to map salinity in the surface waters of the Mediterranean Sea. For example, daily maps can be created using DINEOF, which reduces noise and other sources of contamination. The image, which captures salinity on 3 March 2013, shows the fresher water from the Atlantic Ocean flowing through the Strait of Gibraltar into the Mediterranean Sea. Source: ESA




You must be logged in to post a comment.